
Key Takeaways
Healthcare organizations often have extensive AP data but struggle to turn it into savings. The key is transforming fragmented spending information into actionable insights through clean categorization, benchmarking, contract analysis, and operational validation. Valify helps health systems identify opportunities, execute cost-reduction strategies, and track realized savings across purchased services.
Why Most Healthcare Organizations Still Miss Savings Hidden in Their AP Data
Hospitals already have a massive amount of information about where their money goes. Every invoice, payment, vendor, department, facility, and transaction leaves a record in accounts payable (AP) data.
But having the data is not the same as knowing what to do with it.
A health system may know that it spent millions of dollars on a service category last year. What it may not know is whether several facilities are using different vendors, whether prices vary unnecessarily, how much spending is occurring outside contracts, or whether a contract still represents a competitive rate.
That is where the gap between visibility and savings begins.
For healthcare organizations under growing financial pressure, closing that gap is becoming increasingly important.
Rising Costs Make the Visibility-to-Action Gap More Important
Hospital costs continue to rise across major expense areas. According to the American Hospital Association, total hospital expenses increased 7.5% in 2025. Supply expenses increased 9.9%, while drug expenses increased 13.6%.
Those increases make cost management more than a reporting exercise. Health systems need to understand which expenses can be influenced, where opportunities exist, and what actions can realistically produce savings without compromising patient care or operational requirements.
Purchased services are an important part of that equation. They span a wide range of services, from environmental services and facilities management to IT, laundry, waste management, and other outsourced functions. Because these services are often spread across departments and facilities, the underlying opportunity can be difficult to see.
AP data contains the raw material. The challenge is turning that information into decisions.
Visibility Is Not the Same as Savings
This is the distinction that matters most.
Knowing What You Spend Doesn’t Tell You What to Change
Consider four stages:
Visibility:
“We spent $5 million on this category.”
Insight:
“We spent $5 million across seven vendors, and pricing varies significantly between facilities.”
Action:
“We should evaluate vendor consolidation, benchmark pricing, and negotiate system-wide terms.”
Savings realization:
“After implementation, actual spend decreased, and the savings were tracked against the original baseline.”
The first stage tells you what happened. The later stages help you determine what to do about it.
Valify makes this distinction between traditional reporting and healthcare spend analytics. Traditional reporting can show historical spend, but it does not necessarily explain what is driving that spend or where intervention is possible. Spend analytics restructures the data so services, pricing differences, contracts, and potential opportunities become easier to identify.
A Dashboard Can Show the Problem Without Solving It
ERP systems, AP reports, procurement platforms, and dashboards all have an important role. But better reporting does not automatically produce better savings.
A report may show that a health system spent $5 million on a service. It may not show that the same service is being purchased from multiple vendors, that one facility is paying more than another, or that some purchases are occurring outside preferred agreements.
The goal, therefore, is not another dashboard.
The goal is to make spent data usable for decision-making.
Hidden Costs: Where the Gap Between Data and Savings Begins
Fragmented Vendor Spending
A health system with multiple facilities may have several vendors providing similar services.
Individually, each transaction can look reasonable. Collectively, the spending may reveal an opportunity to consolidate vendors, negotiate at the enterprise level, or conduct a competitive sourcing event.
This is particularly important in purchased services, where decentralized purchasing can make fragmented spending difficult to recognize.
Price Variation Across Facilities
Facility A may pay a different price from Facility B for a comparable service. AP data can identify the difference, but the difference alone does not prove that one facility is overspending.
There may be legitimate reasons for the variation, including service requirements, geography, volume, or contract terms.
That is why benchmarking requires content.
Valify’s benchmarking approach considers factors such as contract terms and conditions, invoice pricing, patient and staff impact, and comparisons with peer organizations.
The question is not simply, “Who pays less?”
It is, “Is our price and service arrangement competitive for what we actually need?”
Off-Contract Spending
A contract only creates value when the organization follows it.
This creates an important distinction:
Contract data = what should happen
AP data = what actually happened
When purchases occur outside preferred vendors or agreements, expected savings can disappear.
Valify specifically identifies decentralized and non-PO spending as a source of rogue spending that can be surfaced through spend categorization and analysis.
Poor Categorization
Vendor names and GL codes do not always tell the full story.
The same type of service may appear under different descriptions, vendors may use multiple names, and related expenses may be distributed across different accounting codes.
Without consistent categorization, leadership may underestimate the size of a category or fail to recognize that seemingly separate transactions belong to the same opportunity.
Contracts That Renew Without a Fresh Look
Renewal should not always be an administrative event.
Historical AP data can provide a starting point for asking better questions:
- Has spending increased?
- Has utilization changed?
- Is pricing still competitive?
- Are other facilities paying less?
- Has vendor performance remained strong?
- Should the agreement be renegotiated or competitively sourced?
The answers can turn a routine renewal into a potential savings opportunity.
Why Healthcare Organizations Struggle to Move From Visibility to Action
The Data Is Distributed Across Systems and Departments
Finance may own AP data. Procurement may manage supplier relationships. Legal may hold contract information. Operations understands how a service is actually delivered.
Each team sees a different piece of the picture.
Bringing those pieces together is essential because a savings opportunity cannot be evaluated properly from a payment record alone.
The People Who See the Spend Are Not Always the People Who Control the Service
This is especially relevant in healthcare.
Finance sees the payment. Procurement sees the supplier. Operations understands the service. Legal sees the contract. Clinical leadership may understand the operational or patient-care requirements behind the purchase.
Finding a potential savings opportunity is only the beginning. The organization still needs the right stakeholders to validate and implement it.
Savings Opportunities Need Operational Validation
Not every pricing difference or spending anomaly represents savings.
Before making a change, health systems need to consider patient-care requirements, service levels, staffing needs, facility differences, contract obligations, and vendor performance.
The strongest savings programs therefore combine data intelligence with operational knowledge.
What a Savings-Ready AP Data Strategy Looks Like
Step 1: Build a System-Wide Spend View
Bring together facilities, departments, vendors, transactions, and service categories to create a consistent view of spending.
Step 2: Clean and Categorize the Data
Move beyond:
Vendor → Invoice → Payment
Toward:
Vendor → Service → Category → Facility → Contract
Step 3: Prioritize the Opportunities
Not every category deserves immediate attention.
Prioritize based on spend level, vendor fragmentation, price variation, contract status, renewal timing, and strategic importance.
Step 4: Benchmark Before Negotiating
Instead of asking only:
“What are we paying?”
Ask:
“What should we be paying?”
Benchmarking adds the market and peer context needed to determine whether an observed difference represents a meaningful opportunity.
Step 5: Connect the Finding to an Action
Depending on the category, the right response may be to renegotiate, source, consolidate, standardize, or improve contract compliance.
Step 6: Track Realized Savings
Savings should not stop at a negotiated price.
Track the baseline spend, negotiated terms, implementation date, actual post-implementation spend, contract compliance, and realized savings.
Valify’s WorkPlan supports ongoing monitoring of savings initiatives, including tracking goals and progress, identifying unapproved spending, and helping teams pinpoint the facility or department behind an issue.
How Valify Helps Close the Visibility-to-Savings Gap
Turning AP Data Into Purchased-Services Intelligence
Valify is built specifically around healthcare purchased services.
Its Spend Analytics Technology cleanses and categorizes AP spend to help health systems understand the full scope of their purchased services expenses and identify potential savings opportunities. The platform combines data categorization with quality controls, benchmarking, market insights, and sourcing tools.
Adding Benchmarking to the Spend Picture
Knowing what a hospital spends is only one side of the equation.
Valify’s benchmarking capabilities add peer and market context, helping organizations evaluate pricing, contract terms, and other factors before deciding whether an opportunity warrants action.
Connecting Analytics With Sourcing and Contracting
The objective is not simply to identify an opportunity and leave the organization to figure out what happens next.
Valify’s cost-reduction approach connects insights, contracts, contracting, and partnering as part of a broader savings roadmap. Its offerings include spend analytics, purchased-services contracts, benchmarking, sourcing, consulting, and ongoing savings tracking.
That connection is important because savings require execution.
From Visibility to Savings Realization: The Complete Journey
The process can be viewed as six connected stages:
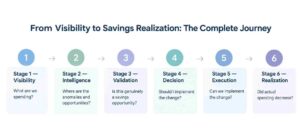
This is the difference between having AP data and strategically managing purchased services.
The New Measure of Spend Analytics Isn’t Visibility. It’s Action.
Healthcare organizations should be asking better questions.
Not only:
“What did we spend?”
But:
“What should we change?”
And ultimately:
“What savings did we actually realize?”
The strongest AP strategy connects finance, procurement, operations, and leadership. Finance provides the expenditure data. Procurement identifies supplier and contract opportunities. Operations validates requirements. Leadership prioritizes execution.
Together, those functions can turn fragmented information into measurable results.
Conclusion: The Data Isn’t the Missing Piece
Healthcare organizations already have much of the raw material needed to identify savings.
The challenge is making that data clean, categorized, contextualized, and actionable.
The goal is not simply more visibility.
It is the ability to move from:
AP Data → Visibility → Insight → Action → Implementation → Realized Savings
For healthcare organizations looking to turn purchased-services data into measurable action, Valify’s Spend Analytics Technology and Purchased Services Solutions provide a healthcare-specific approach to identifying, sourcing, and managing savings opportunities.
Frequently Asked Questions
Why doesn’t having detailed AP data automatically lead to healthcare savings?
AP data shows what an organization paid, but it does not automatically explain whether pricing is competitive, spending is fragmented, purchases are occurring outside contracts, or a better sourcing strategy is available.
What hidden savings opportunities can healthcare organizations uncover in their AP data?
Organizations can identify fragmented vendor spending, pricing variation, off-contract spending, poorly categorized expenses, and contracts that may warrant renegotiation or competitive sourcing.
How can hospitals determine whether price variation represents a real savings opportunity?
Price variation should be evaluated alongside service requirements, contract terms, utilization, facility differences, vendor performance, and peer or market benchmarks.
What steps can healthcare organizations take to turn AP data into actionable cost-reduction strategies?
Start by creating a system-wide spend view, clean and categorize the data, prioritize opportunities, benchmark pricing, select an appropriate action, and track actual results after implementation.
How does Valify help healthcare organizations move from spend visibility to measurable savings?
Valify combines healthcare-specific spend analytics with benchmarking, purchased-services contracting, sourcing, advisory capabilities, and savings tracking to help health systems move from understanding spend to acting on opportunities and monitoring results.
