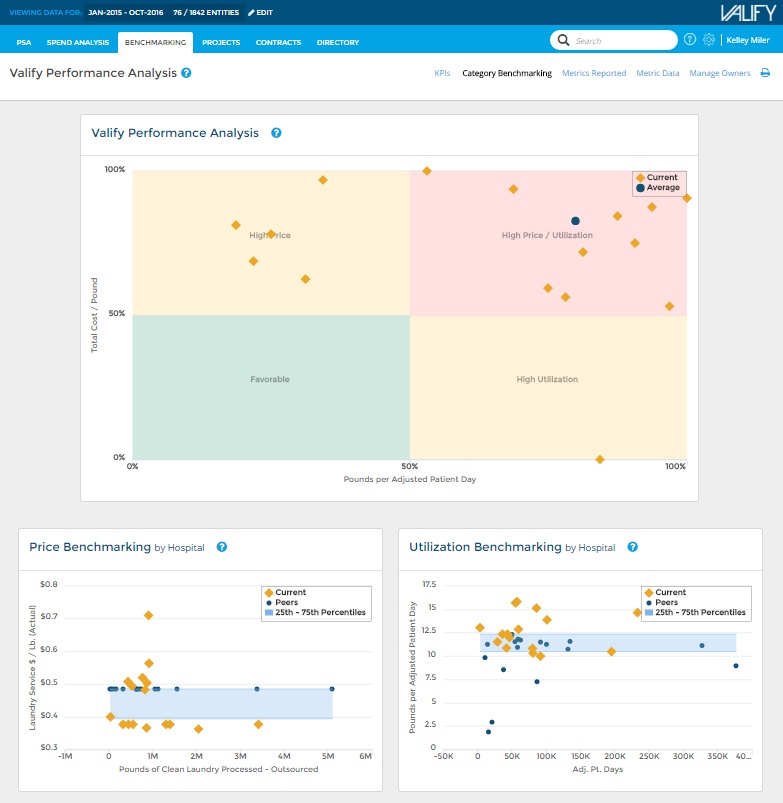
Visualizing purchased services spending is essential for controlling costs at any hospital or health system. After all, purchased services comprise 45 percent of a hospital’s non-labor budget. The ability to drill down on spending across a well-organized hierarchy of more than 1,200 potential purchased services categories provides an even more precise picture of how dollars are being spent. Spending data alone, however, offers only directional insights.
Benchmarking analysis needs be applied to spending to create two significant advantages:
- Health systems gain the ability to accurately evaluate spending against contracted fees and services provided. Timely and reliable benchmarking data exposes runaway utilization and undetected purchasing activity in a particular department or facility.
- Benchmarking delivers a meaningful perspective on how service utilization varies across the health system and against its peer organizations nationwide. While some services, such as energy and landscaping, may vary based on geographic market, other services, such as laundry and food service, should be comparable nationwide for institutions with similar characteristics, after adjusting for regional usage in doses.
Benchmarking offers valuable insight
Key performance indicator (KPI) benchmarking and category-level benchmarking each offer insight into purchased services spending and both can be valuable in negotiating more favorable vendor contracts. The differences between the two are outlined below:
- KPI benchmarking takes the total accounts payable spend in a category and divides it by a standardized metric, such as number of staffed beds or number of employees. These benchmarks are directional in nature, useful for identifying categories in which the hospital may be spending more or less than its peers.
- Category benchmarking is calculated using not only spend data but also a wealth of operational metrics. Category benchmarking pinpoints where overspending is occurring and provides data that can be used to improve performance. For example, with linen and laundry services, category benchmarking delivers metrics such as: spending per pound of laundry, the number of pounds generated per patient day, and even insight such as how the length of the contract or laundry distribution method affects overall costs. This is much more detailed than what KPI benchmarking can measure for the same category.
Take the next step with category benchmarking
Valify maintains the industry’s largest database of more than $120 billion in categorized purchased services spending, updated monthly with data from hundreds of hospitals of all sizes and geography. Only Valify is able to offer this level of timely, reliable benchmarking insight through targeted performance dashboards. Powered by the real-time purchased services spending data that Valify delivers, category-level benchmarking is the advantage health systems need to identify potentially millions of dollars of savings opportunities.
To learn more about the importance of benchmarking purchased services spending and the exclusive insight that Valify offers, please download our white paper, “Benchmarking Purchased Services Spending is Essential to Identifying Savings Opportunities.”

